
SustiraFeatures
Continuously record and accumulate environmental data such as temperature, humidity, power, and CO2.
Sustira provides the features to bring your organization's commitment to the work environment into a state that management can explain.
Dashboard
Real-time data monitoring and time-series analysis through an intuitive interface
Current Status View
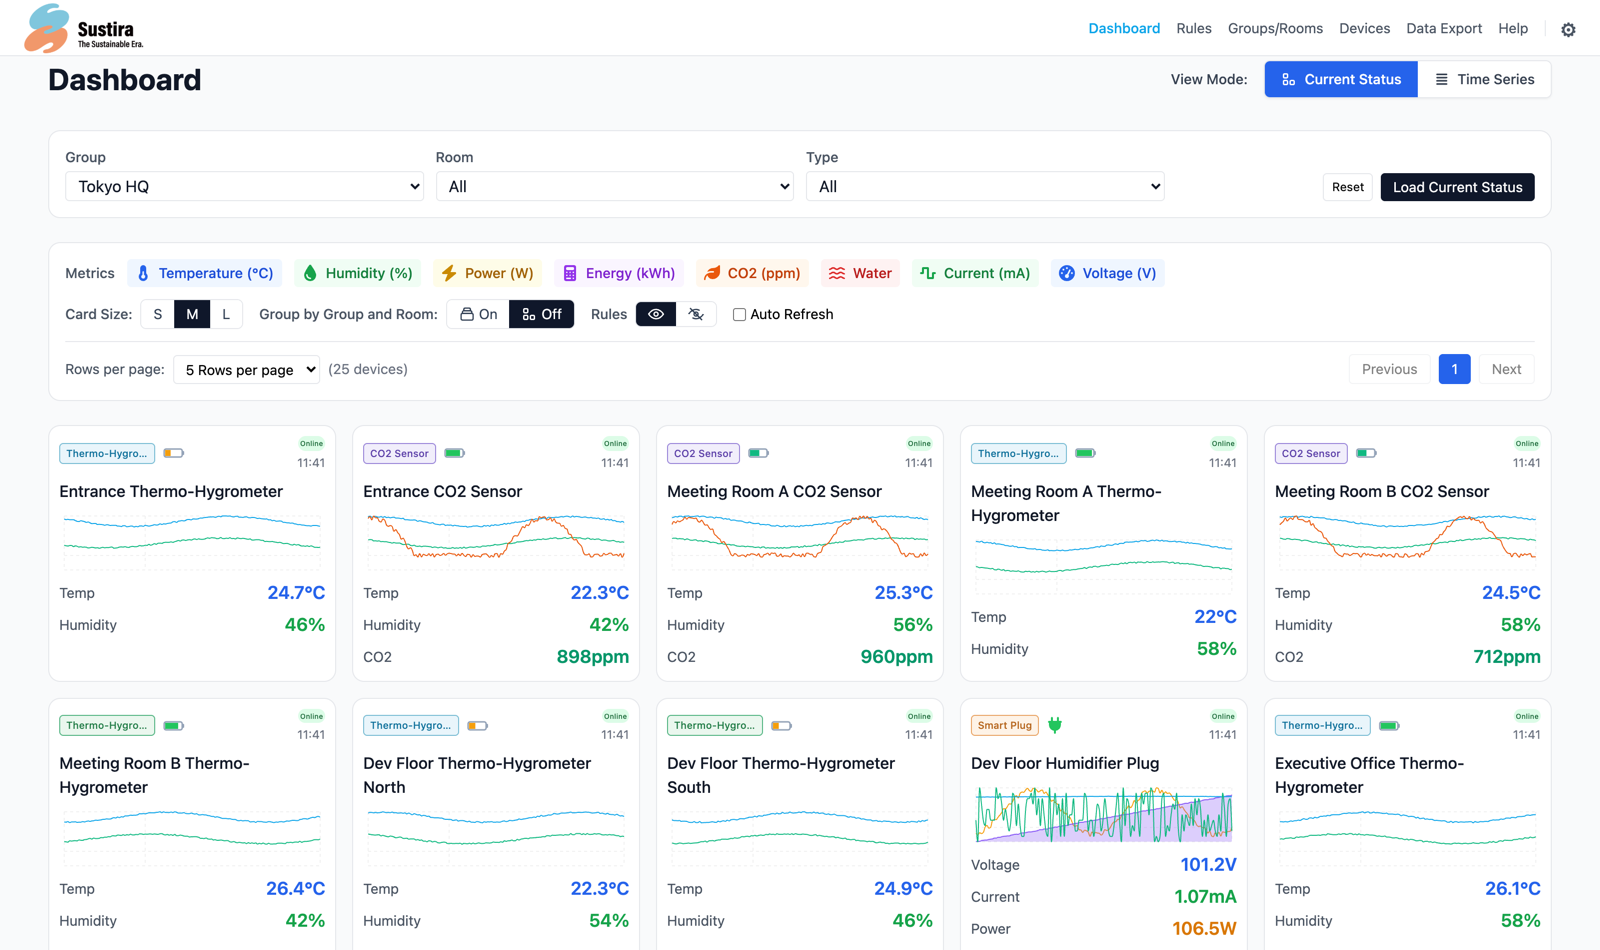
Real-time Monitoring
Displays each device's current values as cards. Data updates automatically at the configured interval (in minutes), so you always see the latest status.
Multiple Metrics
Show temperature, humidity, power, energy, CO2, and water leak at the same time. Toggle only the metrics you need on or off.
Advanced Filtering
Narrow down devices by combining multiple conditions such as device type and group/room.
Display Customization
Adjust card size (small/medium/large), group by location, and use pagination to manage large numbers of devices efficiently.
Time Series View
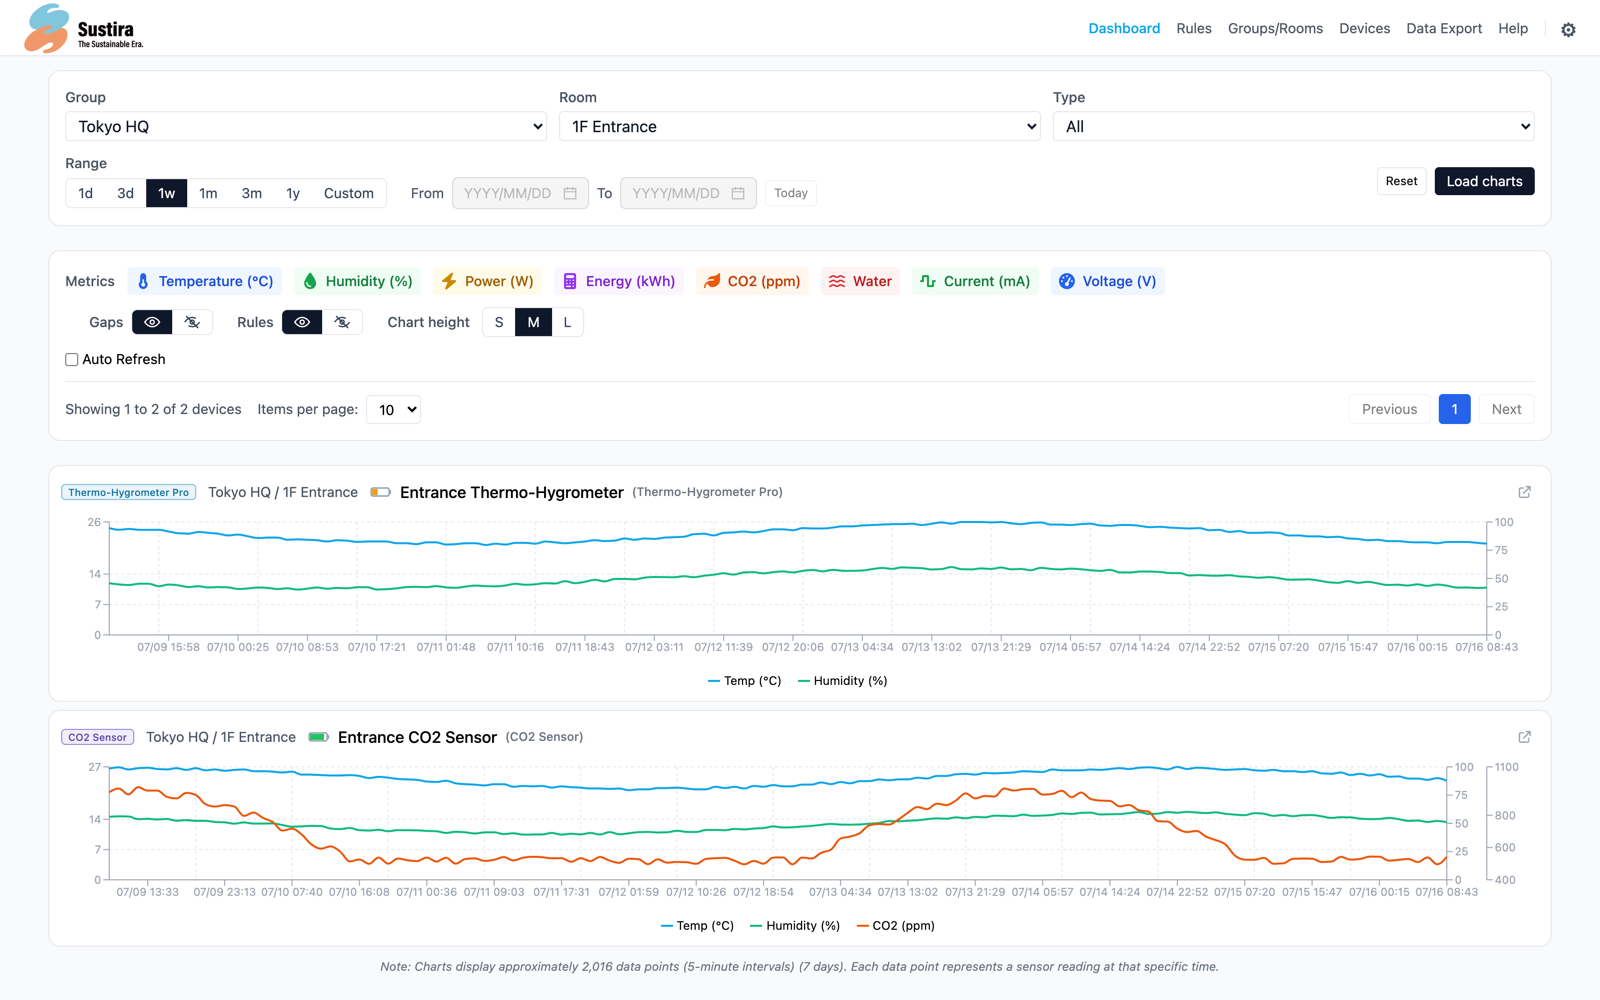
Chart Display
Visualize historical data as time-series charts, helping you grasp trends and spot anomalies.
Flexible Period Selection
Display data over the period you need — 1 day, 3 days, 1 week, 1 month, 3 months, 1 year, or a custom range.
Chart Settings
Fine-grained customization such as chart height, showing or hiding data gaps, and global power-factor settings.
Rule Overlay
Display configured rules (baseline/range) on the chart to support visual recognition of threshold breaches.
Device Management
Comprehensively manage your sensor devices — the source of your data — from registration to detailed configuration
Device Registration & Management
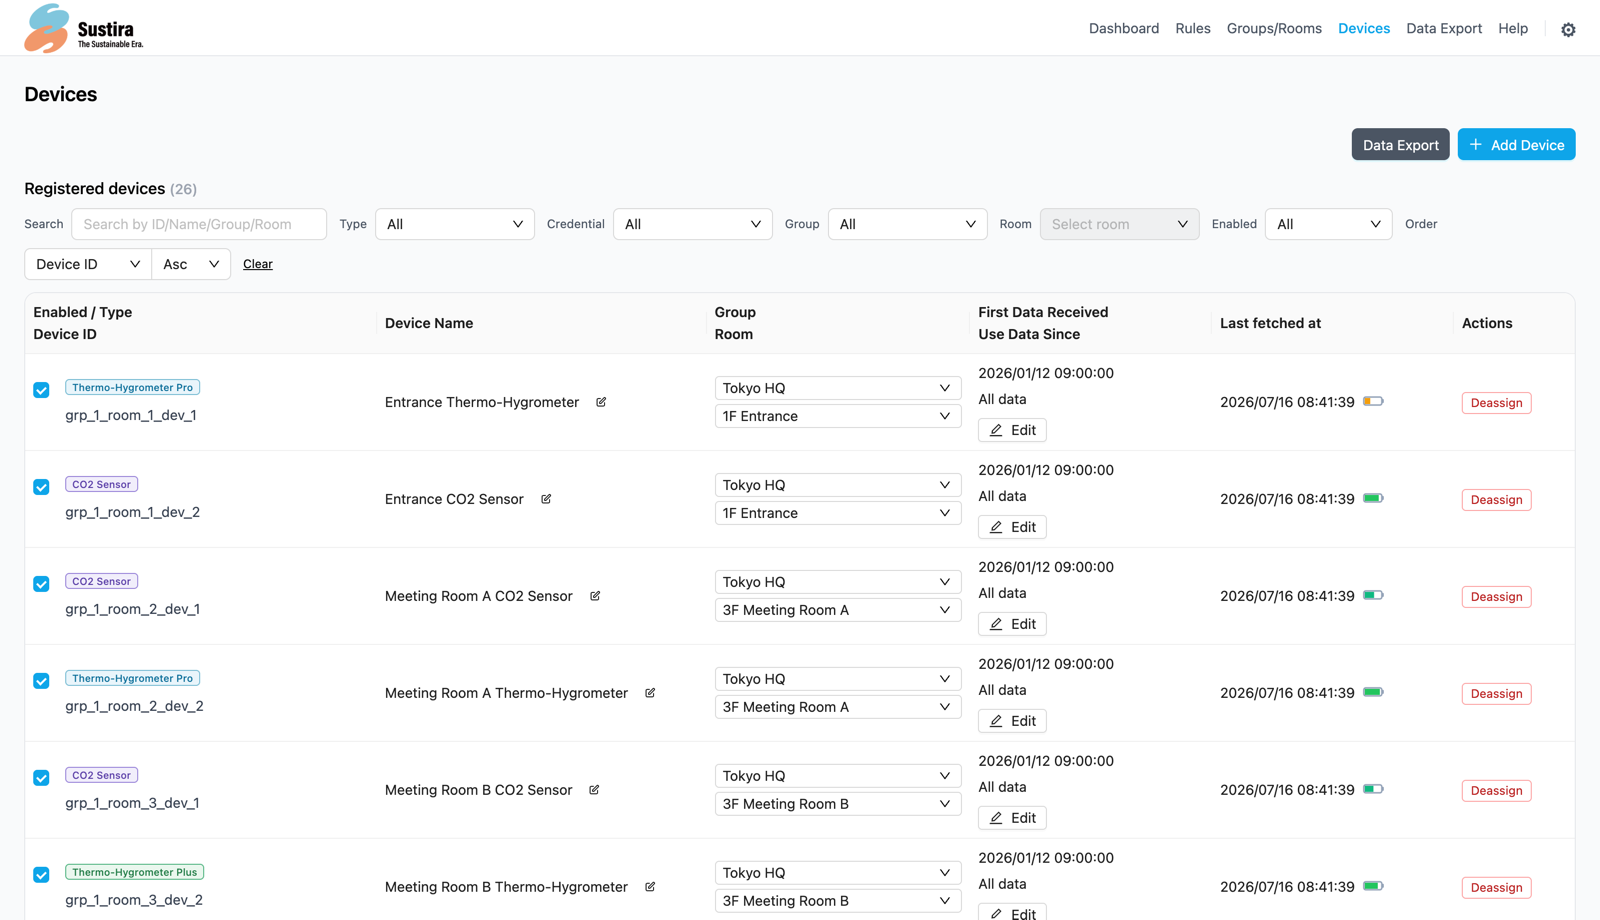
Device Registration
List unregistered devices retrieved from the API and register the ones you need by selecting them, keeping setup work to a minimum.
Edit Device Information
Flexible management including editing device names, assigning devices to groups/rooms, and toggling enabled/disabled.
Detailed Information
See information such as device type, battery level, last data-acquisition time, and first data reception at a glance.
Advanced Filtering
Search and sort by multiple conditions such as device ID, name, group, room, type, and enabled/disabled status.
Supported Device Types
Thermo-Hygrometer
SB Thermo/Hygrometer Pro
SB Thermo/Hygrometer Plus
Smart Plug
SB Smart Plug mini
(Power & energy measurement)
CO2 Sensor
SB Meter Pro (CO2)
Indoor air-quality monitoring
Water Leak Detector
SB Water Detector
Early detection of leaks
Groups & Rooms
Hierarchical management that mirrors your facility structure, systematically managing multiple sites, floors, and rooms
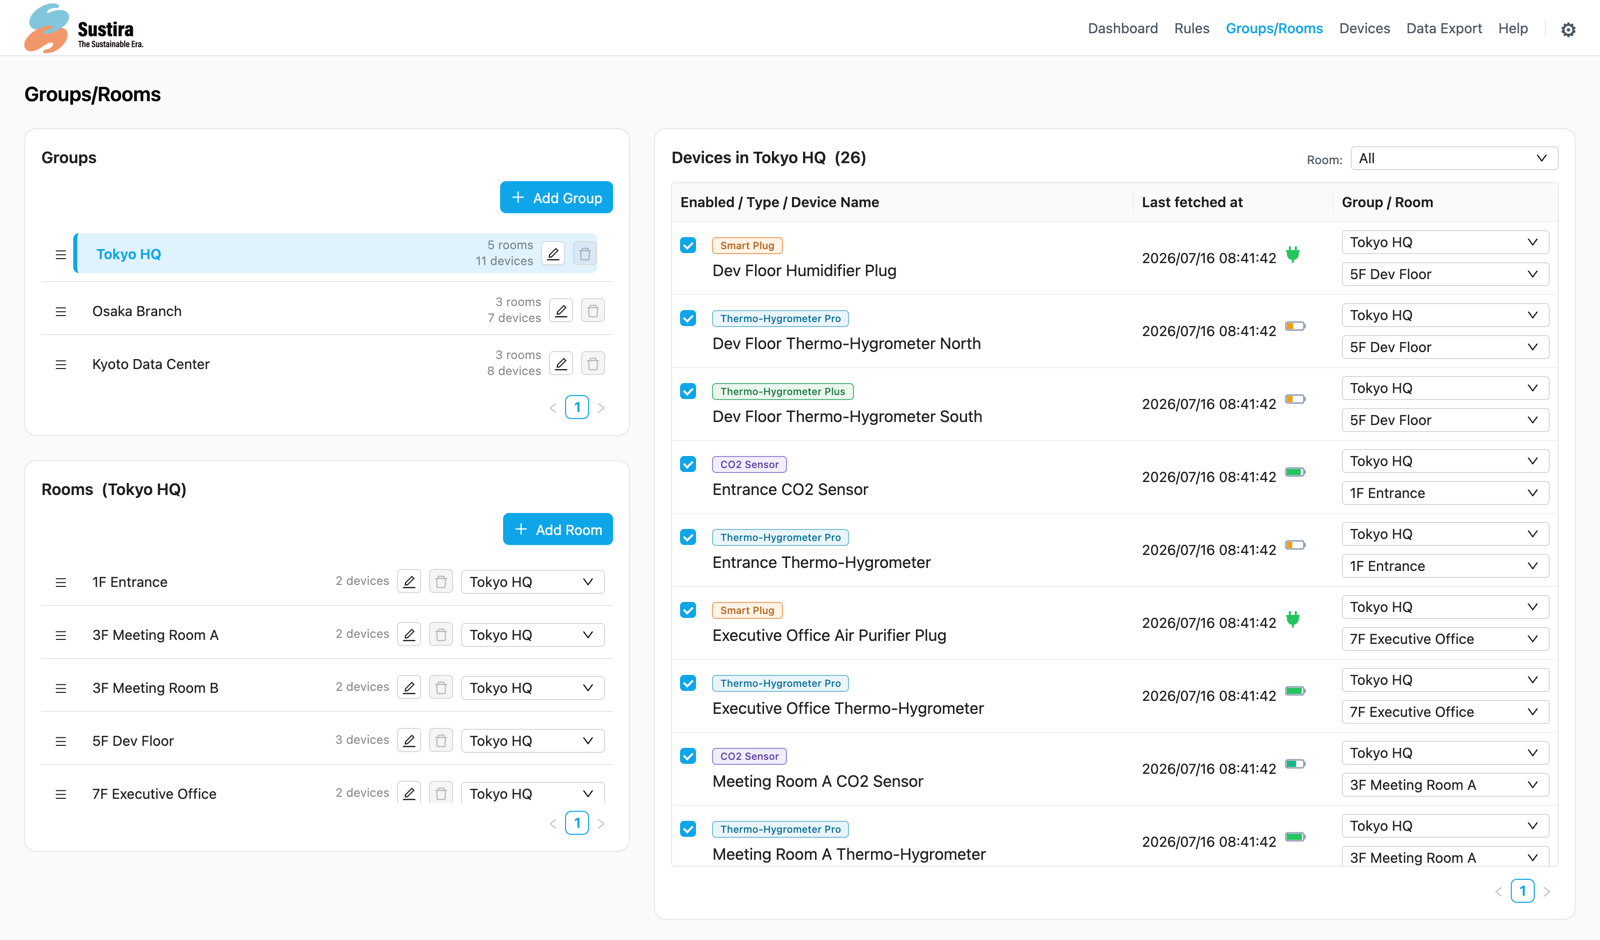
Group Management
- Create, edit, and delete groups
- Reorder by drag & drop
- Show room and device counts per group
- Represent facilities, sites, floors, and more
Room Management
- Manage rooms under a group
- Move rooms between groups
- Reorder by drag & drop
- View the device list per room
Rules
Threshold visualization and alert notifications that support early detection of and response to environmental anomalies
Visual Overlay Settings
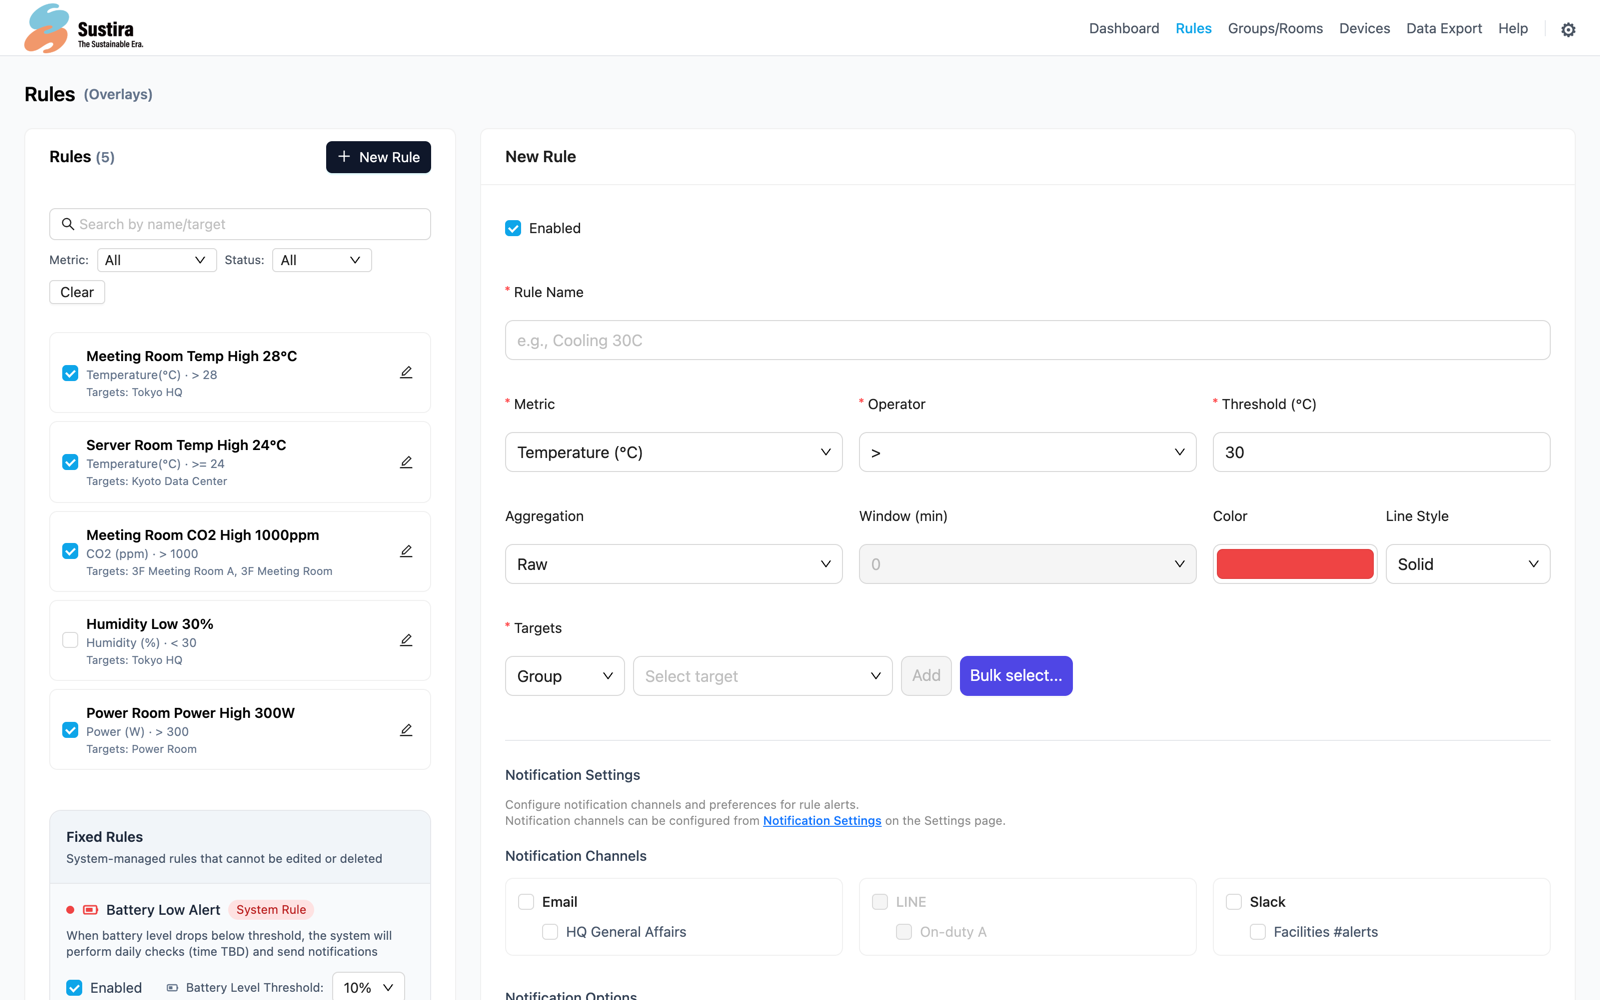
Rule Creation
Create rules that display baselines or ranges on dashboard charts. Supports temperature, humidity, power, energy, CO2, and water leak.
Flexible Comparison Conditions
Choose comparison operators to suit your needs — single thresholds (>, >=, <, <=, =, ≠) or ranges (between/outside).
Aggregation Settings
Evaluate using Raw data or Average (5-, 15-, 30-, or 60-minute windows).
Visual Customization
Freely customize the on-chart display, such as color and line style (solid/dashed).
Fixed Rules & Notifications
Battery Low-Voltage Alert
With battery-level thresholds (5%, 10%, 20%, 30%) and a daily check, you can anticipate battery depletion in advance.
Notification Channels
Supports multiple channels such as Email, Slack, Teams, and LINE Works, with recovery notifications and spam prevention built in.
Data Export
Export your accumulated environmental data as CSV for analysis in external tools
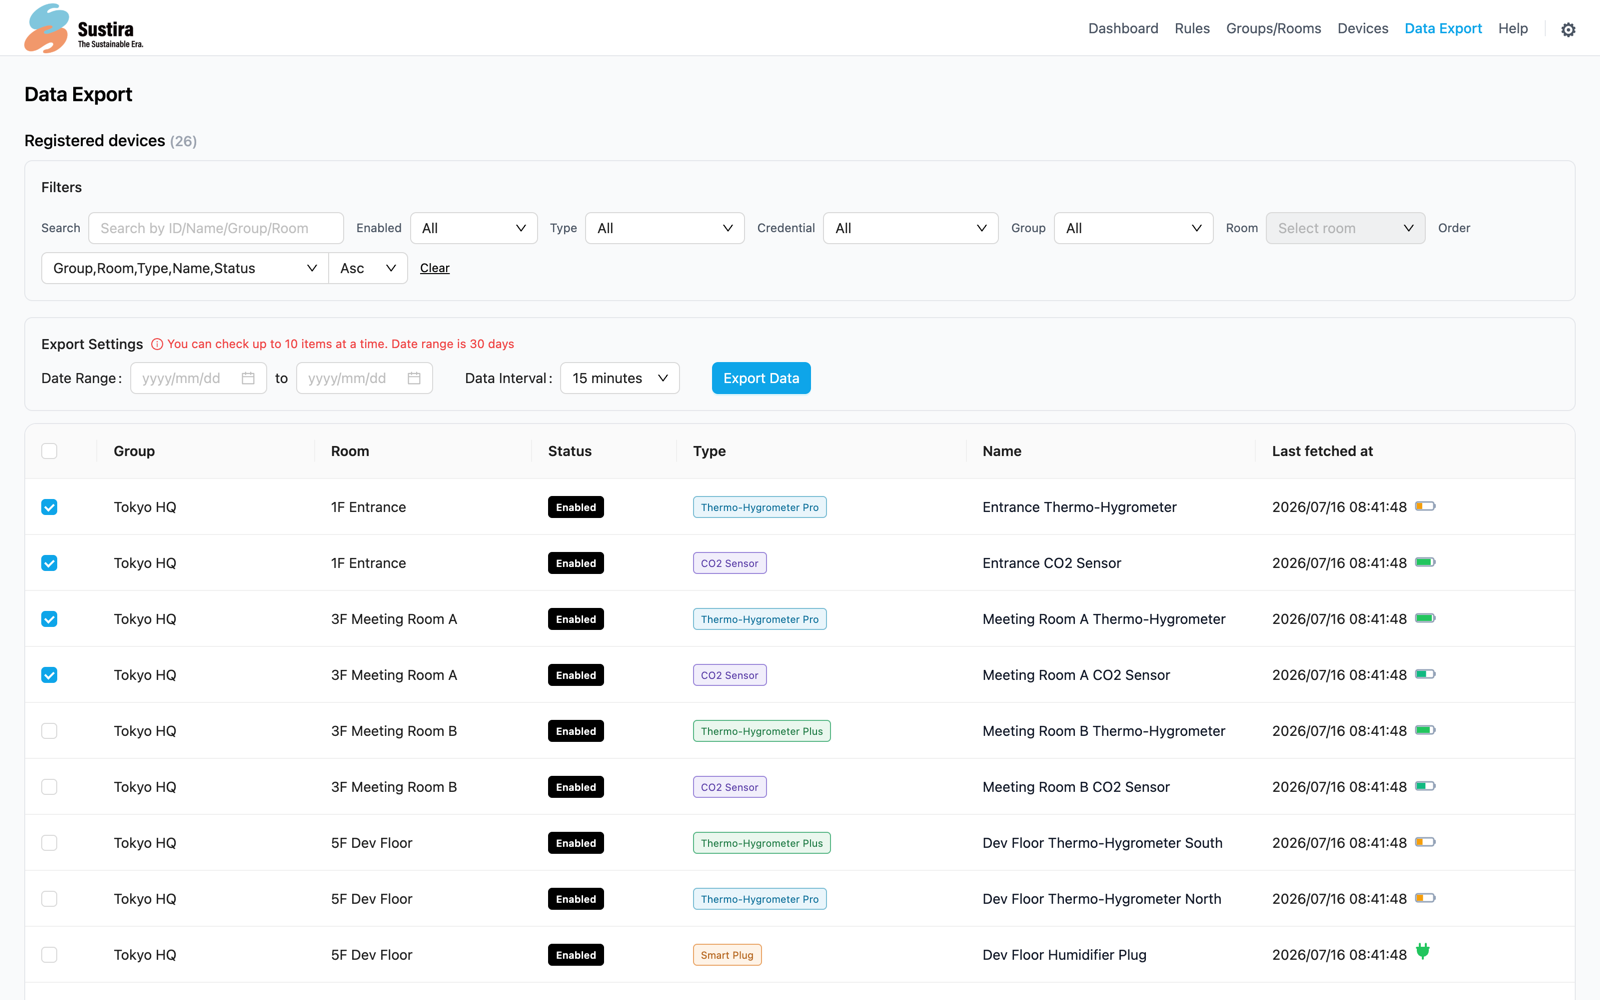
Device Selection
Freely select the devices to export with checkboxes. Filters help you narrow targets efficiently.
Date Range
Specify start and end dates to extract only the data for the period you need.
Data Interval Settings
Choose a data interval to suit your needs — 15 min, 30 min, 1 hour, 4 hours, 6 hours, 12 hours, 1 day, and more.
Progress Display
A progress bar shows processing status in real time, so even large exports run with peace of mind.
Settings
Centrally manage system-wide settings such as API keys, notifications, and subscriptions
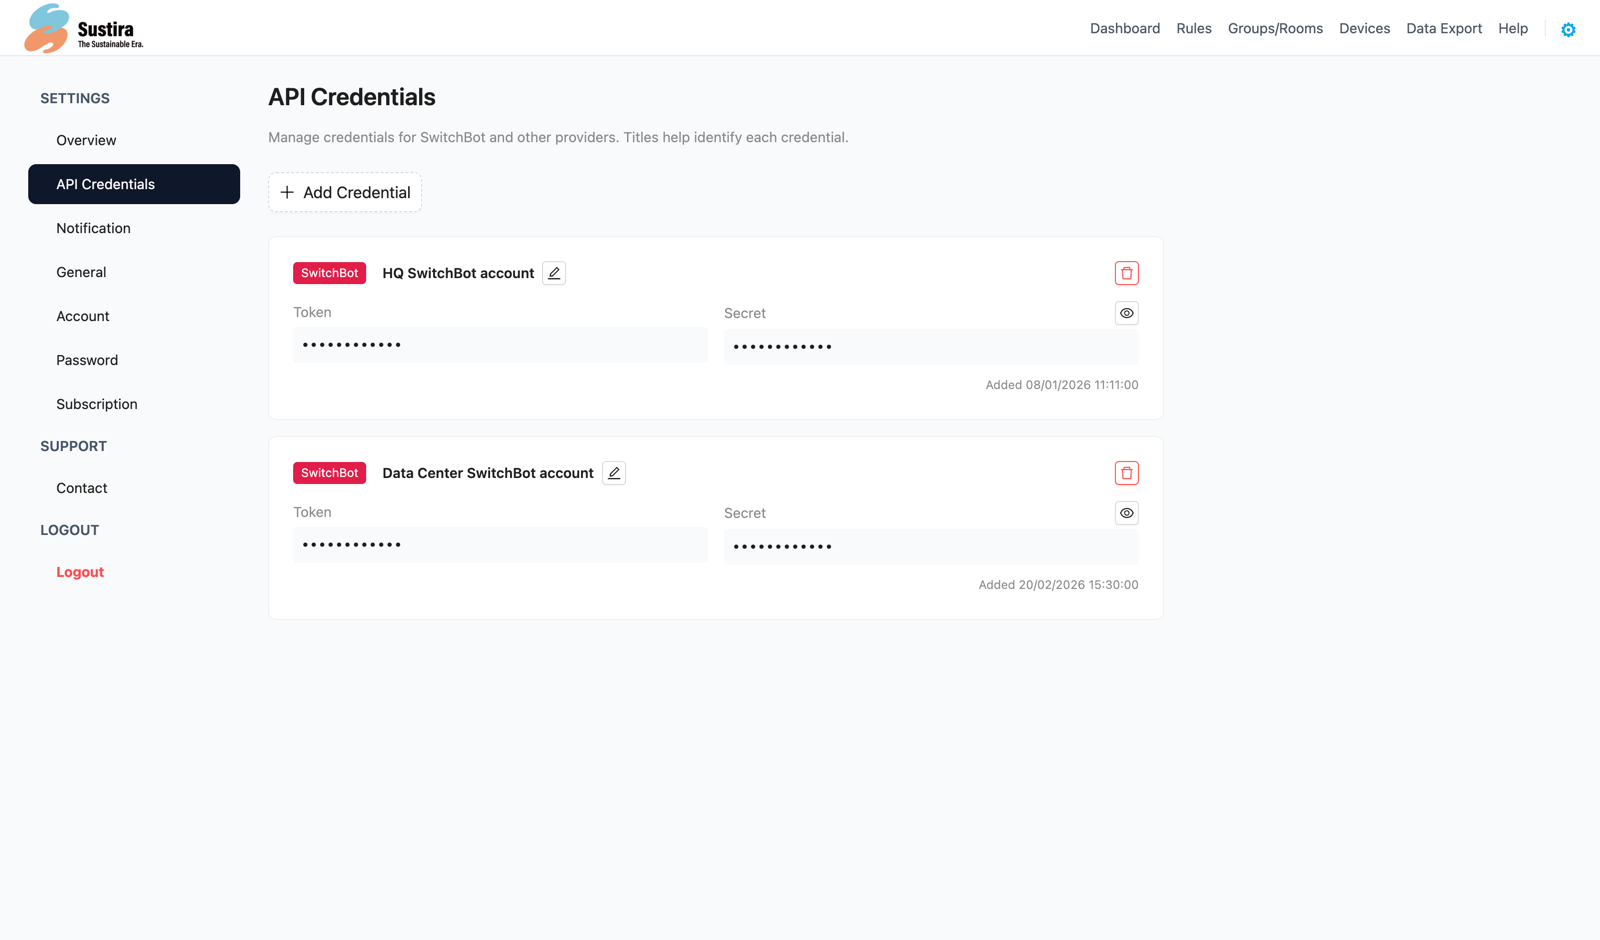
API Key Management
Register and manage API keys for services such as SwitchBot. Manage multiple credentials and assign them per device.
Notification Settings
Configure notification channels for Email, Slack, Teams, and LINE Works. Enable or disable each channel individually.
Contract Management
Check your plan, manage billing information, and confirm your contract period.
General Settings
Manage system-wide basics such as language (English/Japanese) and time zone.
Use Cases
Office Environment Management
Monitor office temperature and humidity in real time. Contributes to HVAC efficiency, cost reduction, and a comfortable workplace.
Data Center Management
Environmental monitoring of server rooms, anomaly detection for temperature and humidity, and visualization and optimization of power consumption.
Explaining Environmental Data
Continuously record energy usage and CO2 emissions. Period comparisons visualize trends, and primary-data export accumulates the evidence to explain your commitment to the work environment to third parties.
Facility Management
Centrally manage environmental data across multiple facilities. Enables group/room-level management with early detection of and alerts for anomalies.
Evaluate Sustira's Features
For evaluation in a real environment, use Pilot (a 21-day evaluation period).
Try key features such as the dashboard, time-series view, and period comparison firsthand.
Not sure which plan is right? We will recommend the plan that fits your company best.